Profiling and compiler optimizations
I work with colleagues at Uber on profiling infrastructure and on using production profiles to guide optimization. This is part of Perf Factory, our effort to automate performance analysis and optimization across Uber’s services.
Profiling
I’ve worked with colleagues at Uber and Grafana on always-on profiling across Uber’s 6,000+ services. We use profiles to investigate CPU use, memory allocation, and lock contention.
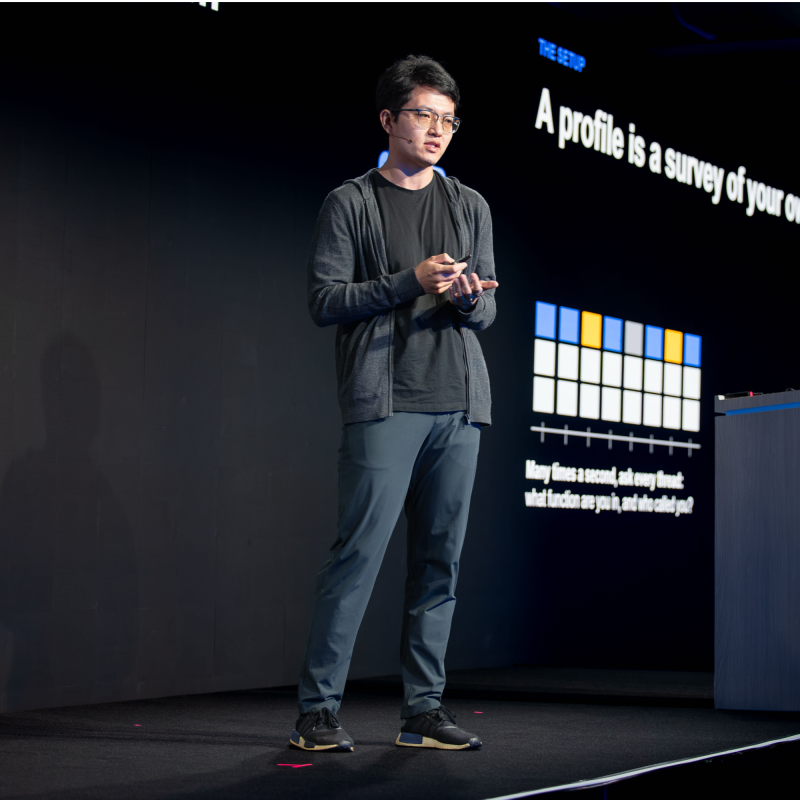
The infrastructure work includes deciding which instances to profile, managing collection without blocking applications, and making profiles available for investigation. My ObservabilityCON talk covers the design, failures we encountered, and what we learned from performance fixes.
Go profile-guided optimization
I also work on integrating Go PGO into production build and deployment workflows. The work brings together profile collection, compilation, testing, and performance monitoring. Keeping build times practical is part of making this useful to service owners.
Current work
I’m working on bringing profiles and program analysis into agent workflows that investigate bottlenecks, propose changes, and check their effects on performance and program behavior.